CHRISTMAS COMES IN SEPTEMBER,
NOT DECEMBER, FOR FEDERAL CONTRACTORS.
TOP 10 TAKEAWAYS
1. BIGGEST DAYS
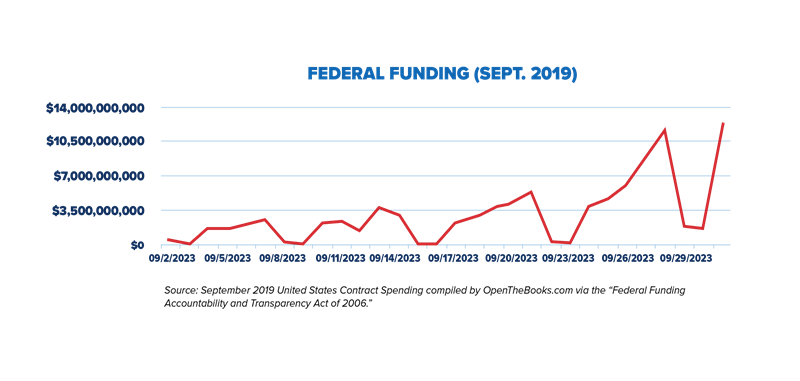
$23.8 billion in contracts flowed during the final two business days of the year. Monday, September 30, the last day, broke all records: $12.2 billion. Friday, September 27, the second to last business day, recorded $11.6 billion.
2. LAST 9 DAYS
$51 billion flowed to federal contractors during the last nine days of the fiscal year – an amount that exceeded all other months (October 2018 through August 2019). The only days under $1 billion in procurement were on weekends or the Labor Day holiday.
3. THE MONTH (SEPTEMBER)
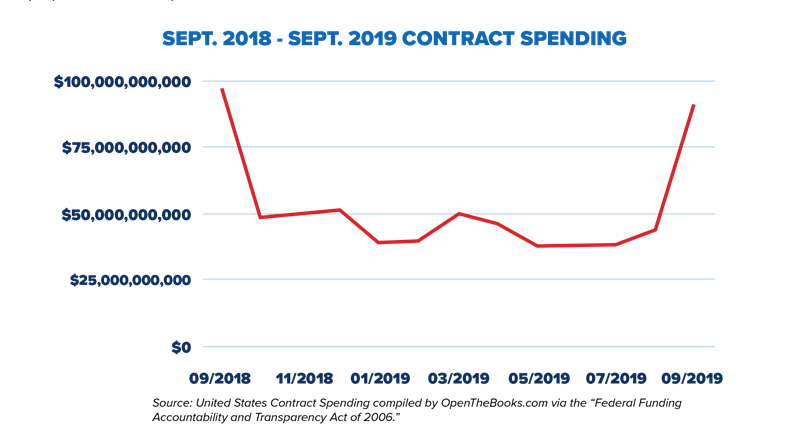
In 2019, federal agencies spent $91 billion on 642,567 transactions – an average of $3 billion on 21,418 transactions each day. During a 2-year period, the year-end spending spree totaled $188 billion (Sept. 2018 & 2019).
4. CRAZY SPENDING
Alcohol ($502,026); guns and ammunition at non-military, non-law enforcement agencies like HHS, VA, and ED ($1.5 million); games, toys and musical equipment including pianos, flutes, and French horns ($3.7 million); lobster tail and snow crab ($4.6 million); golf carts, motorcycles, scooters, bicycles ($6.2 million); books and pamphlets ($23 million); workout and recreation equipment ($25.1 million); batteries ($53 million); vehicles ($253.8 million); public relations and marketing ($456.8 million); and furniture ($457.8 million).
5. A 5-YEAR COMPARISON
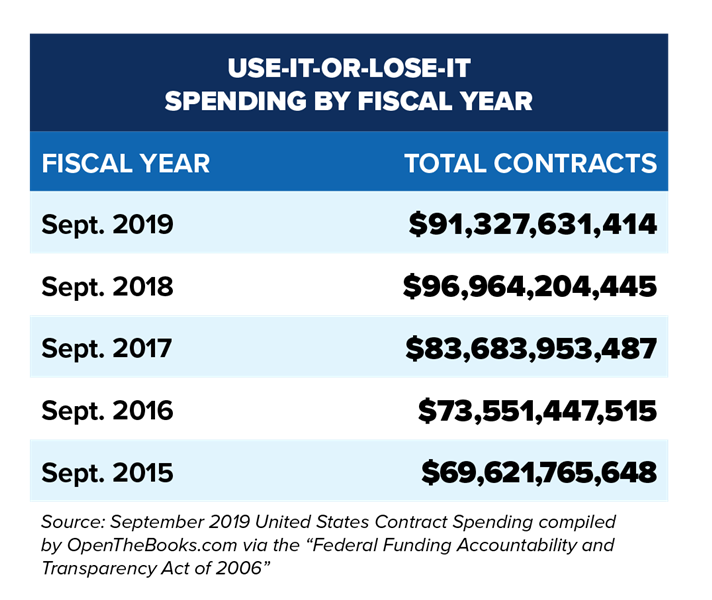
Since 2015, federal spending in September increased by $21.7 billion (23.8%). However, the one-year trend was down – decreasing by $5.6 billion (6.2%).
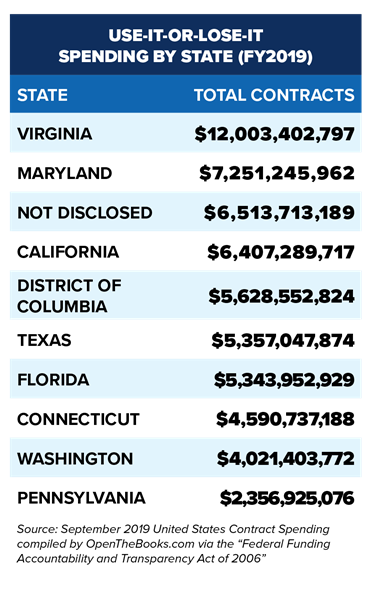
6. THE BELTWAY STIMULUS
$24.9 billion in contracts flowed into contractors located inside the D.C. Beltway (Virginia, Maryland, and District of Columbia). Therefore, the year-end spending spree amounted to a de facto economic subsidy for the DC beltway.
7. TOP AGENCIES
$74.1 billion or 81% of all contract spending, happened within just 5 departments:
Defense: $57.5 billion
Health & Human Services: $5.7 billion
Veterans Affairs: $3.8 billion
General Services Administration: $3.6 billion
Homeland Security: $3.5 billion
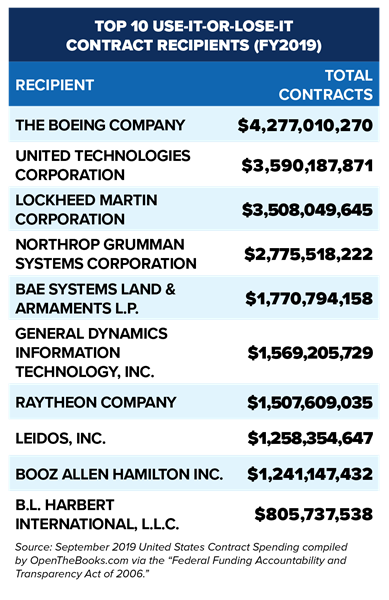
8. TOP RECIPIENTS
$22.3 billion – or $1 in every $4 – flowed to just 10 federal contractors.
9. TOP CATEGORIES
$28.5 billion in September contracts fell into just 10 major categories including fixed-wing aircrafts ($5.2 billion), professional support contracting ($4.4 billion), and gas turbines and jet engines ($4.4 billion). Overall, the spending was across the board and classified into 2,000 categories.
10. FOREIGN CONTRACTORS
$6.5 billion flowed to contractors located in 192 countries outside the United States (7.1%). Top-receiving countries included Germany ($692.7 million), Afghanistan ($561.3 million), Japan ($444.7 million), Canada ($212.9 million), and Saudi Arabia ($211.1 million).